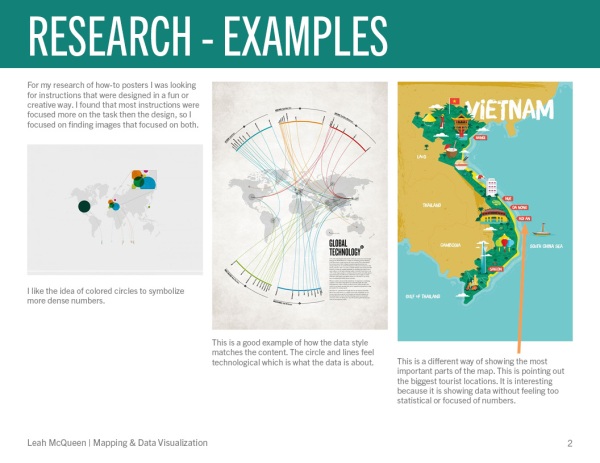
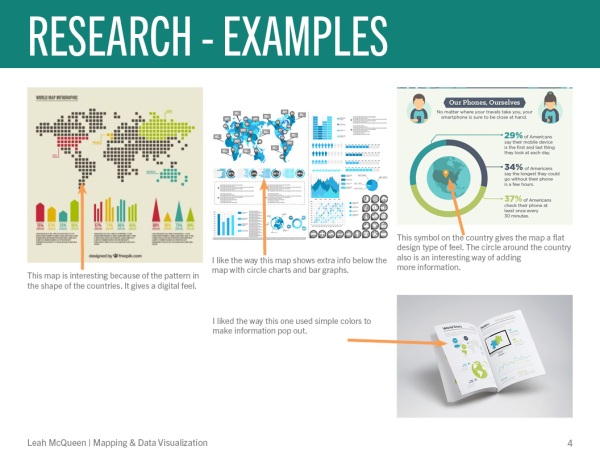
This week I started a project about showing data on a map and physically. I started out with some research.
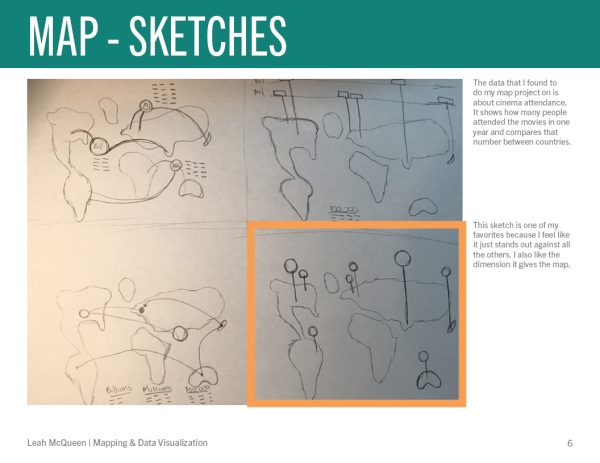
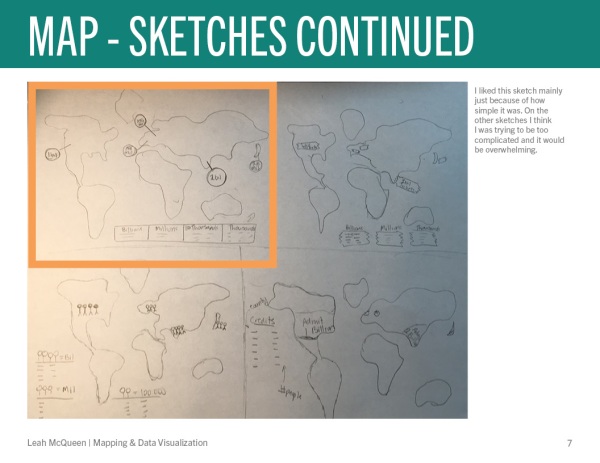
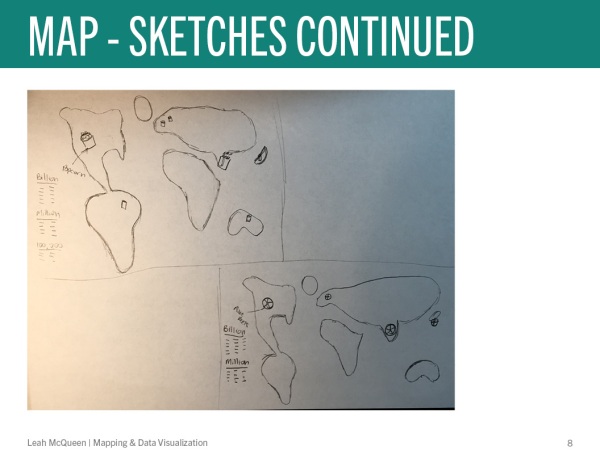
After my visual research, I went into sketching ideas for my map and for my physical representation of the data.
Finally, I made some digital sketches of a map that represents data for the number of people who attend the cinema in a year.

