This is still a work in progress. I will update it as I finish.
The first thing that I did was try a new version of the poster. I tried adding more categories (100 millions, 10 millions, 1 millions and so on), but it didn’t go well. This was the result of that.
Once I had decided that this idea wasn’t really working, I went back to my previous idea and refined it. I changed the colors of the numbers to give them more contrast and moved the words to make them easier to see. 
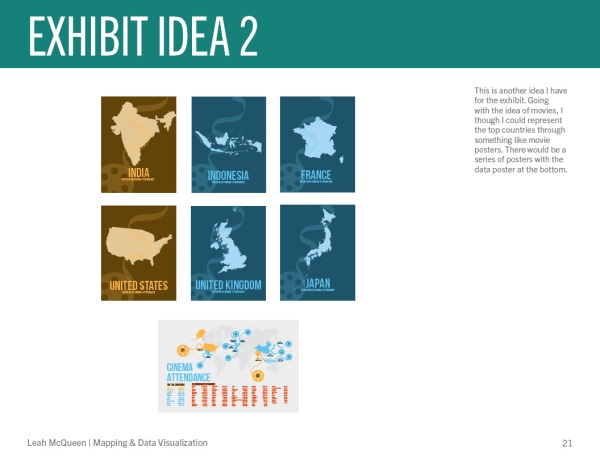
I then started experimenting with exhibit ideas. For the first, I thought about hanging film reels which could represent countries. The closer the film reel is to the front, the more people attend the cinema there. The second idea is to make a series of movie posters that show the top countries next to the data map.


Here are some larger versions of the images above:


